Gentrification Summer Camp (Statistics and Data Visualization)
qgisgoogle sheetsadobe illustratoradobe photoshop
The DIVAS for Social Justice Summer Camp on Gentrification ran for 5 weeks in the Summer of 2014 at the Weeksville Heritage Center.
Youth aged 7-12 from the local community learnt and practiced photography, 3D printing, financial literacy, statistics, maps and data to understand and reflect on gentrification and their changing neighbourhood.
For the Statistics and Data Visualization stream, we met once a week and participated in group discussions about Bedford Stuyvesant. The participants described their understanding and observations about Gentrification in the neighbourhood.
The youth learnt about statistics, the history of Bedford Stuyvesant, and examined maps, charts and other information that helped them understand the neighbourhood and the changes.
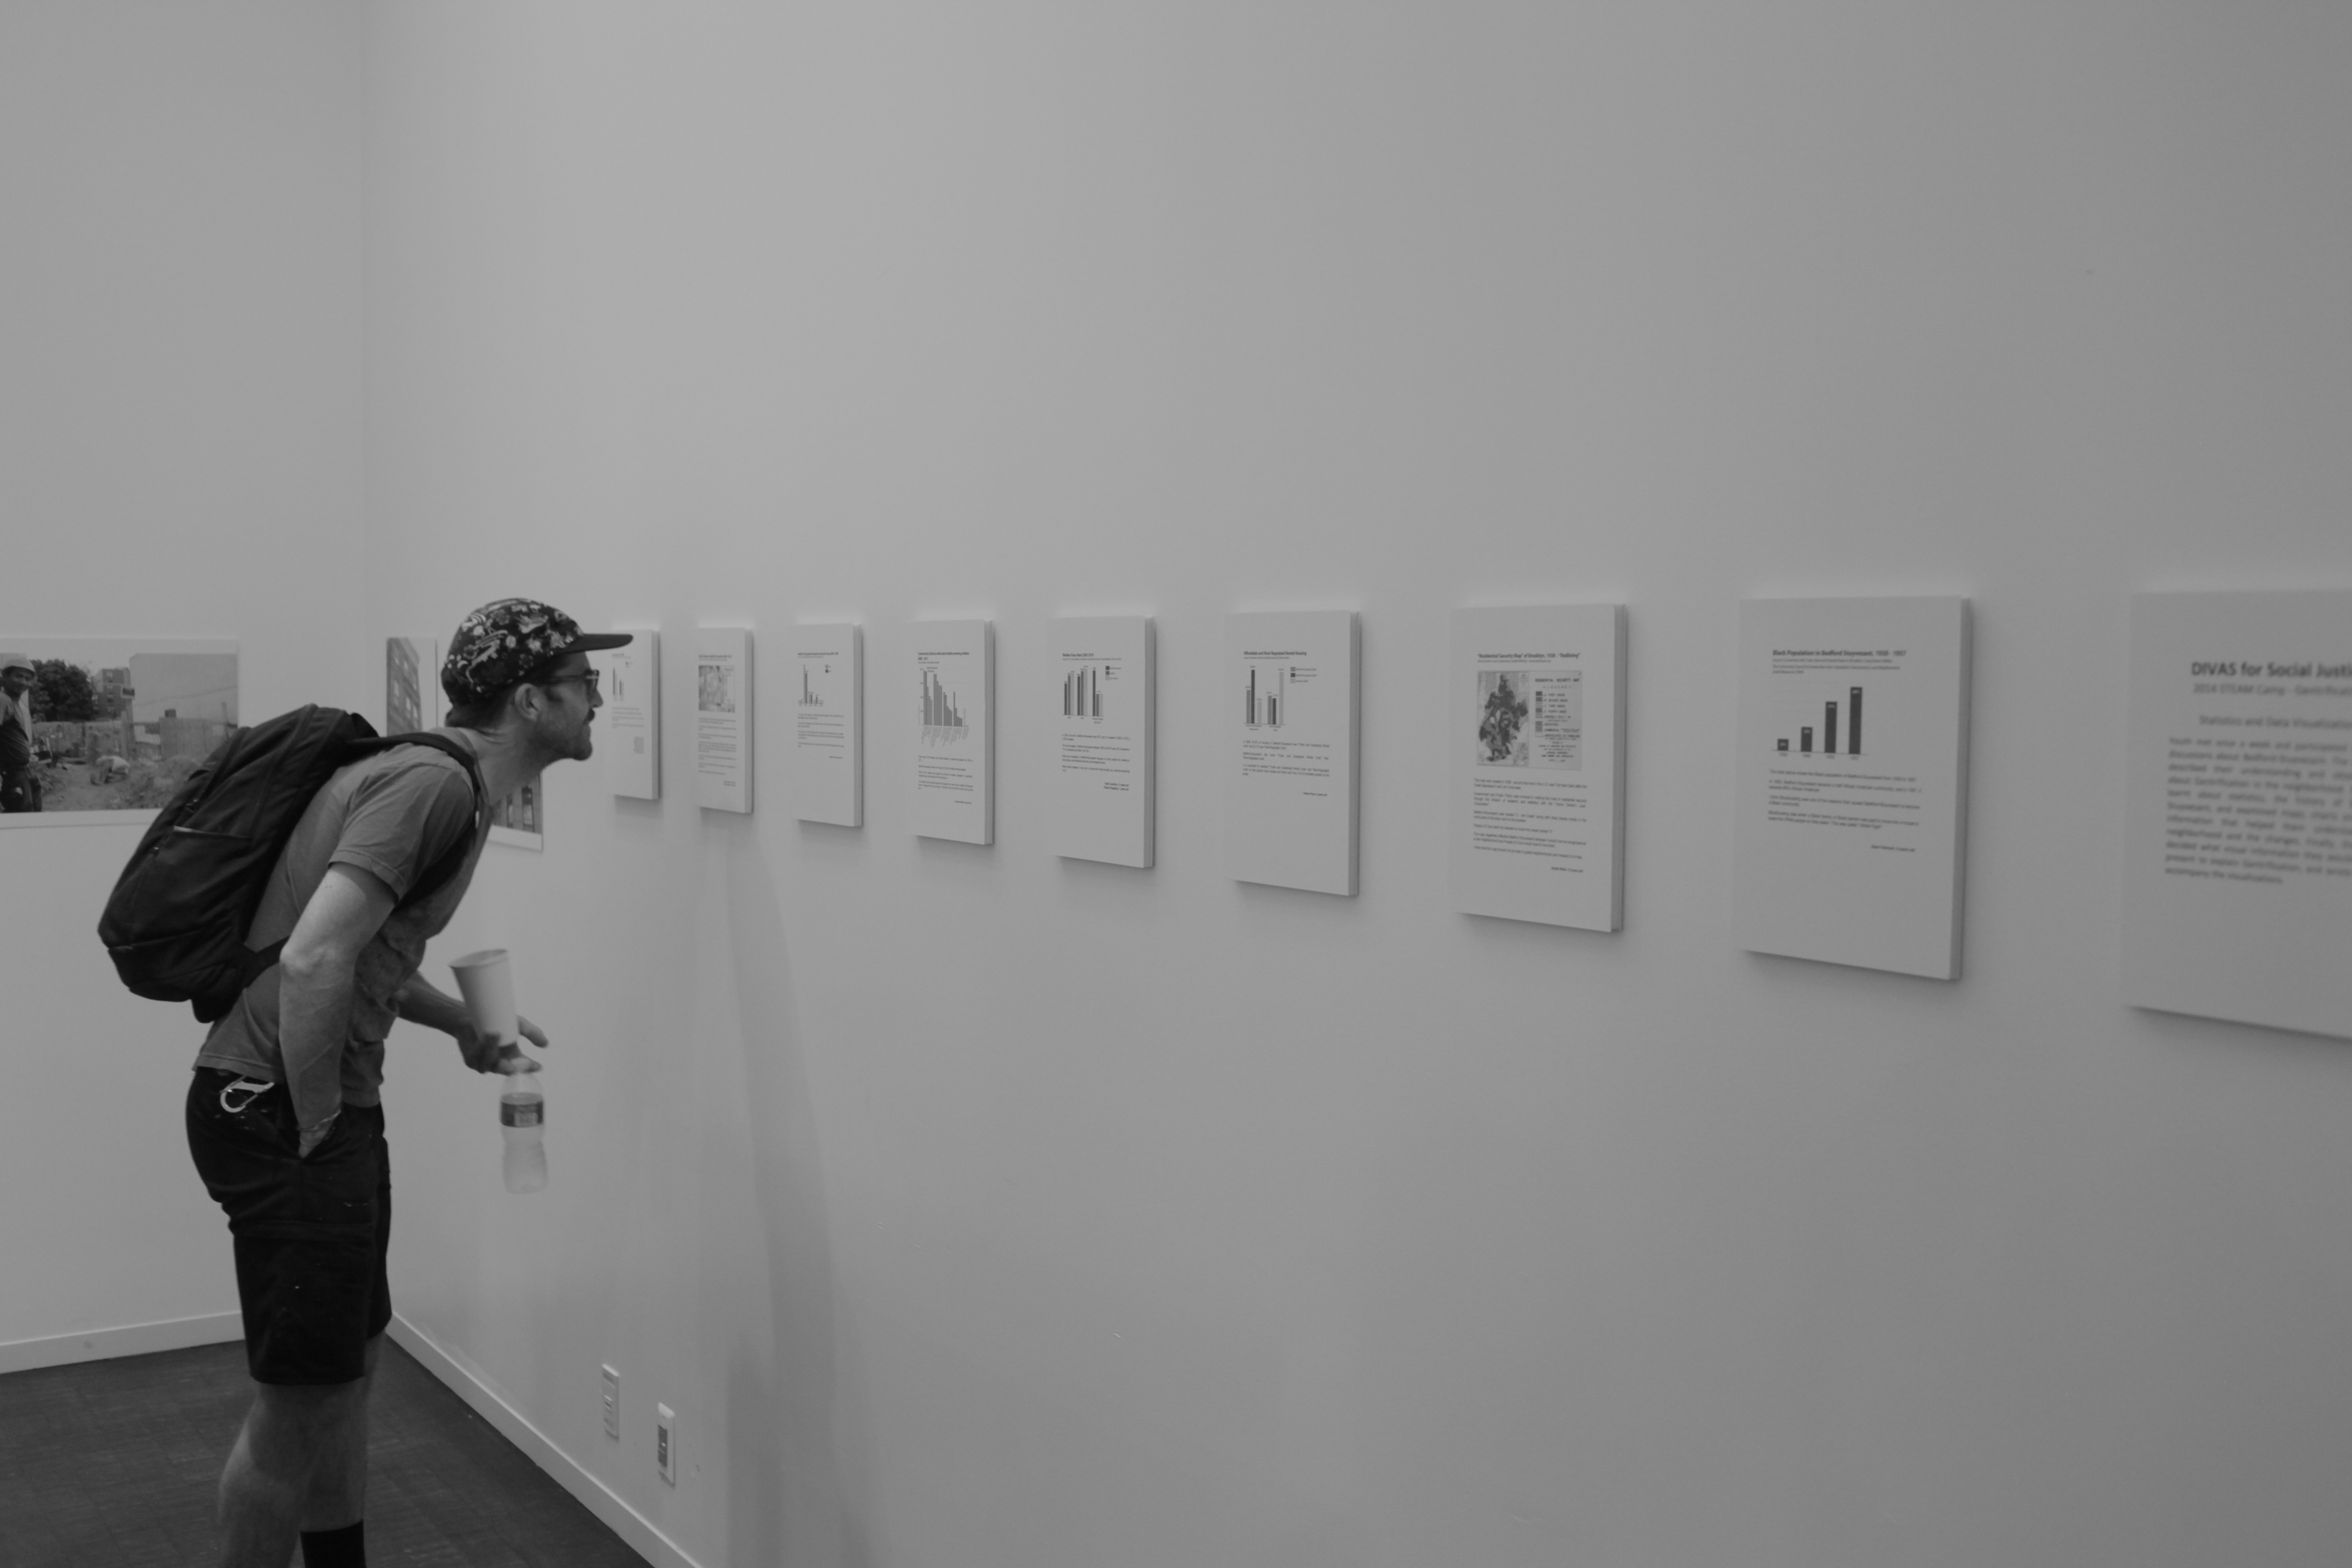
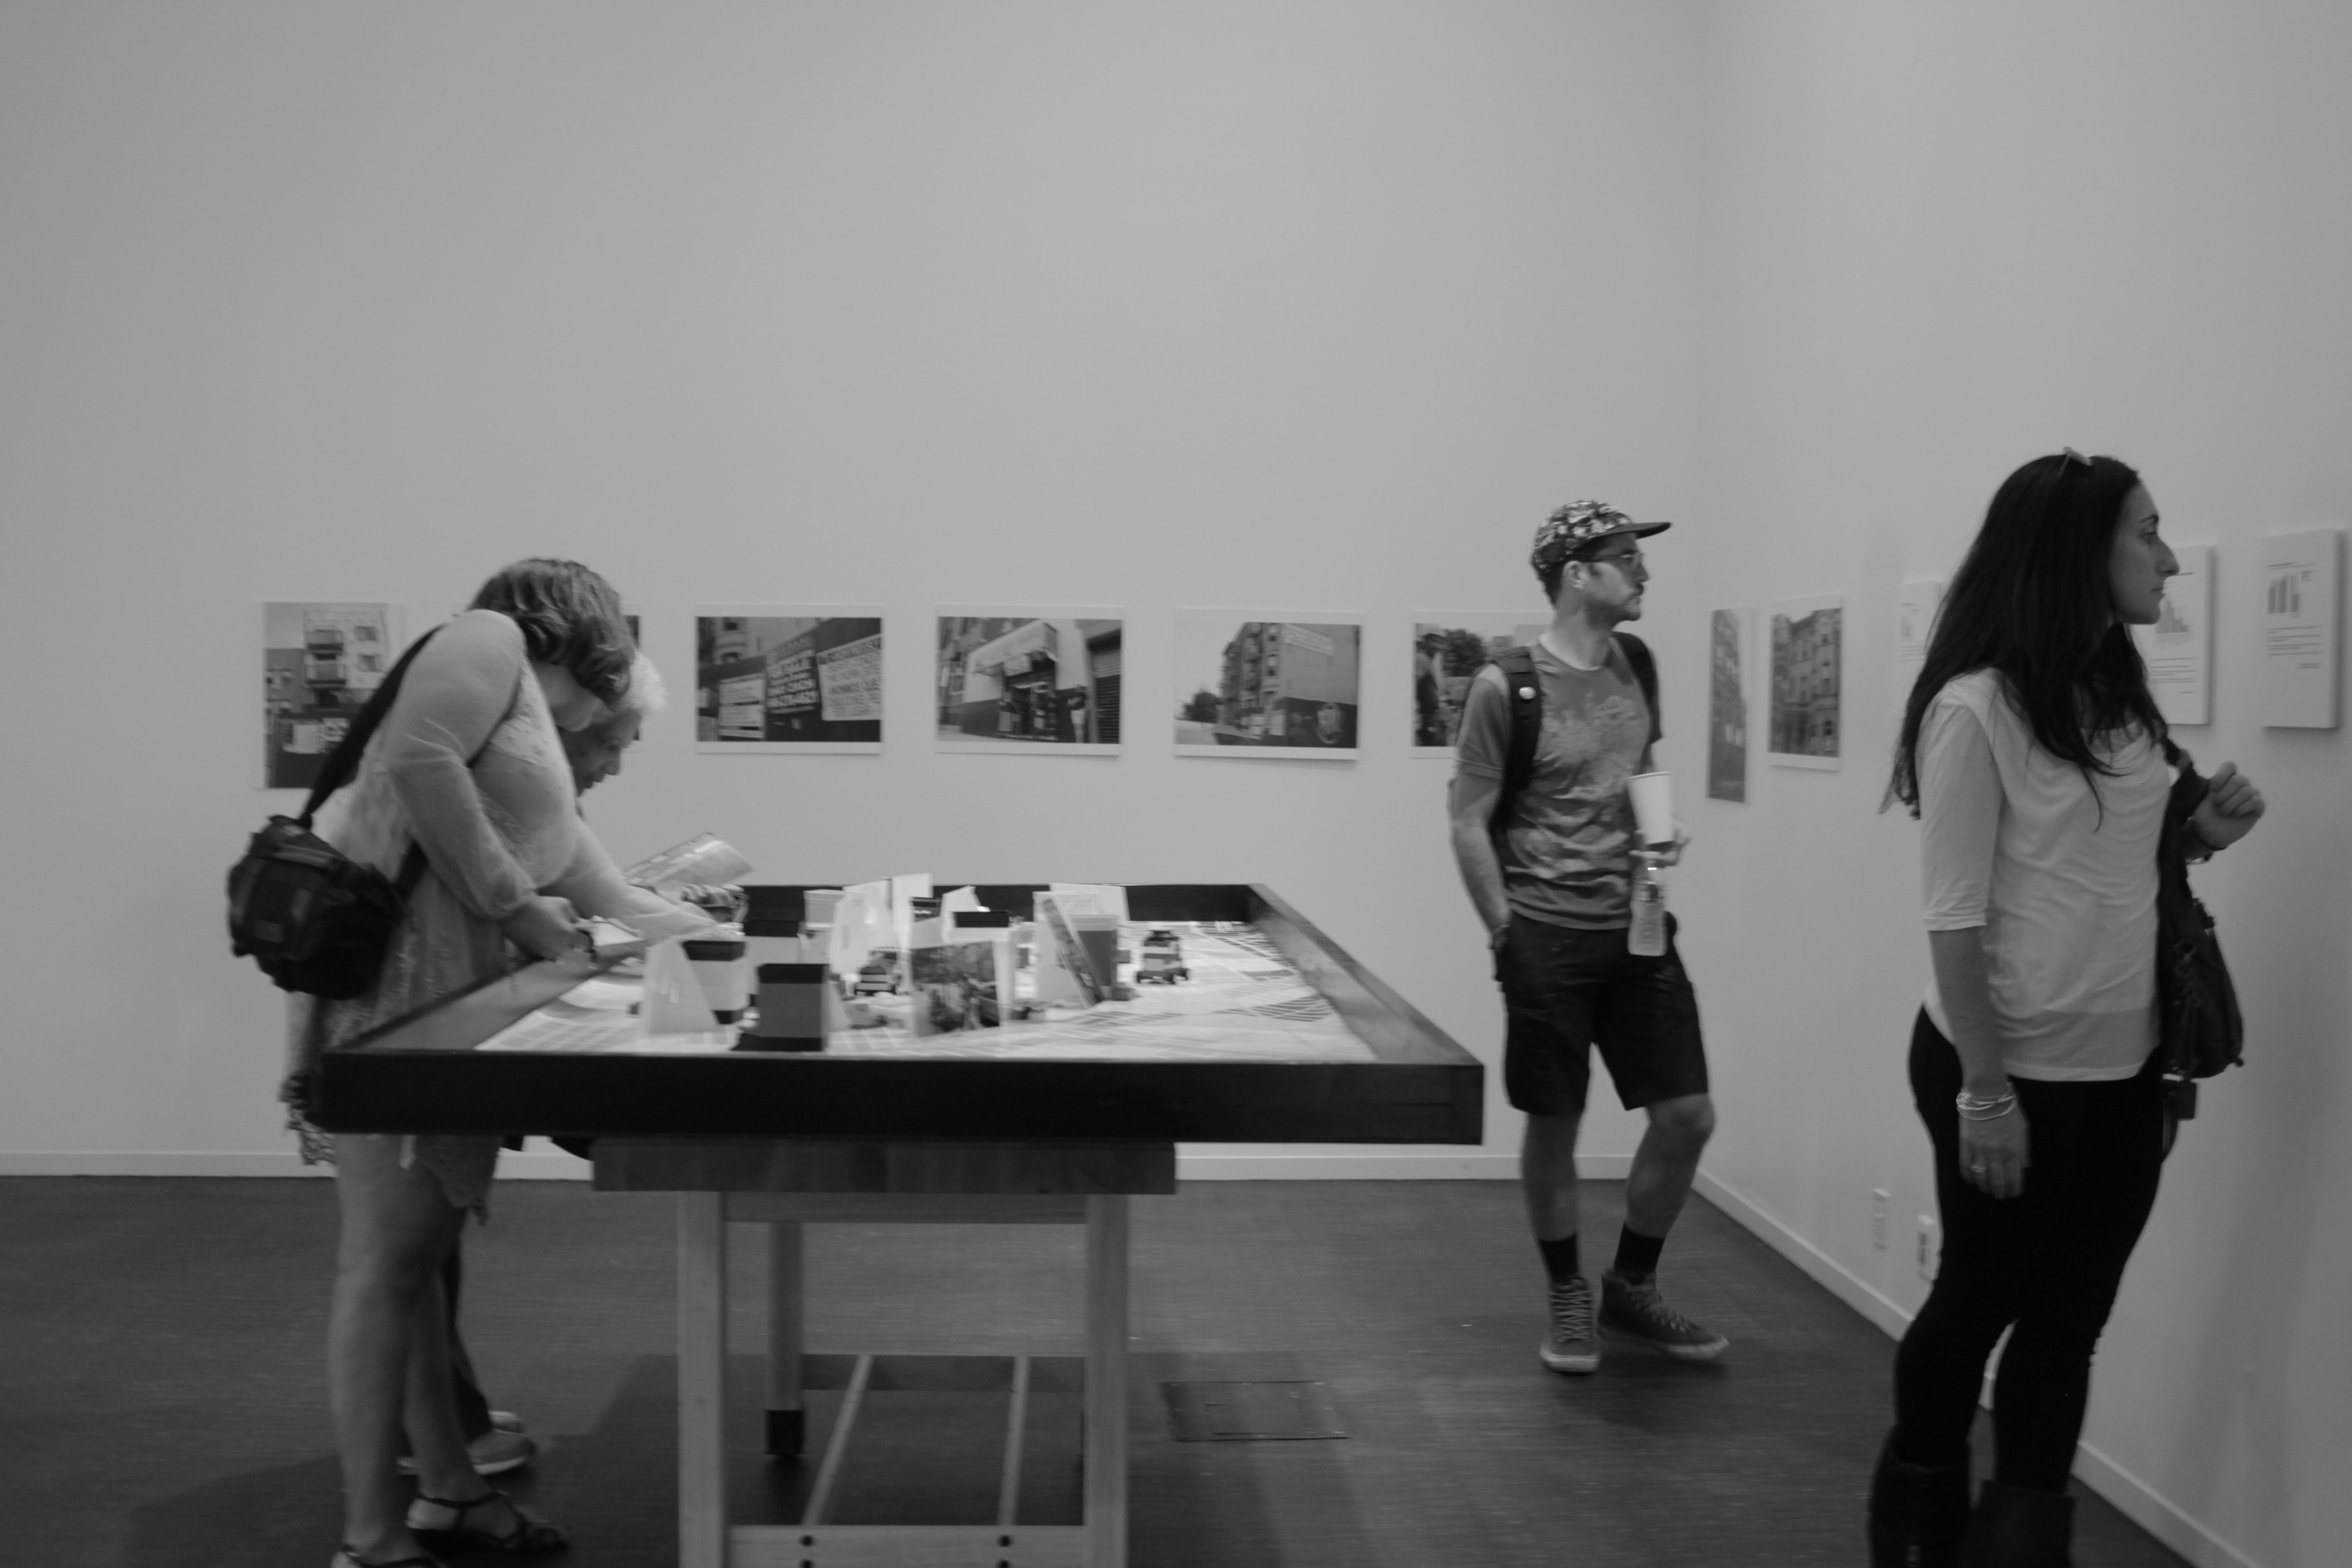
Finally, the youth decided what visual information they would like to present to explain Gentrification, and wrote text to accompany their visualisations.
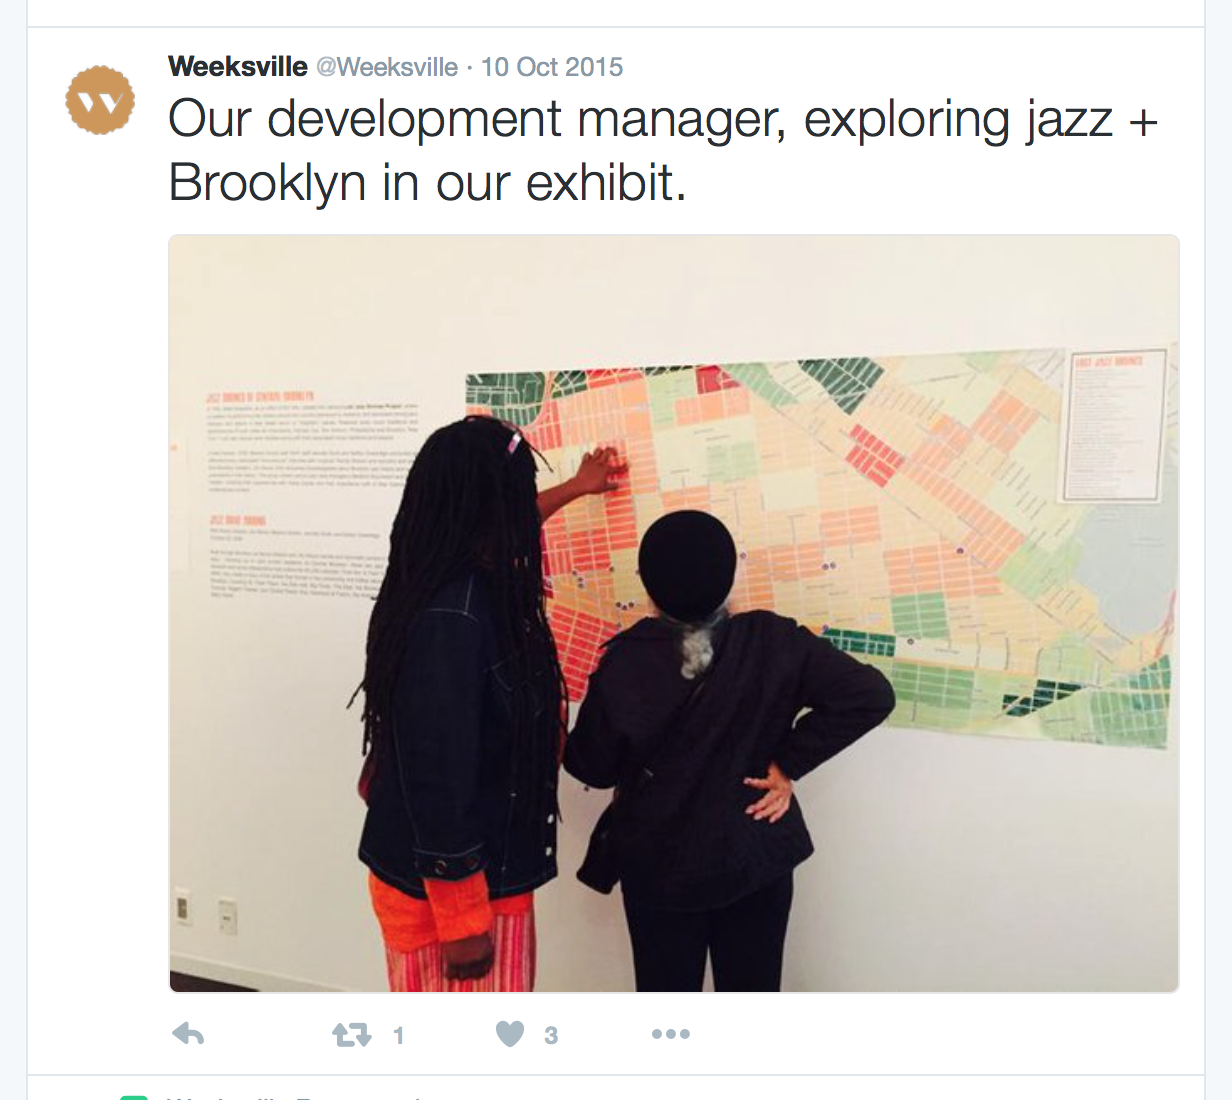
A 8' wide racial demographic changes map was produced and along with the visualisations, was exhibited alongside Creative Time’s “Black Radical Brooklyn” at the Weeksville Heritage Center.